What Does Target ROAS Actually Do?
I built a simulated ad market to explore how bidding and pricing interact, and why individually rational choices can leave every competitor worse off.
Intro
Most explanations of smart bidding and target ROAS stop at a simple idea: higher tROAS means more conservative bidding, and lower tROAS means more aggressive bidding.
That is true, but it leaves out a lot of interesting structure. How does changing bidding aggressiveness change CPC, conversion rate, and profit?
I couldn’t find much that explored this from first principles, so I built a simple simulated ad market to see how it might actually behave.
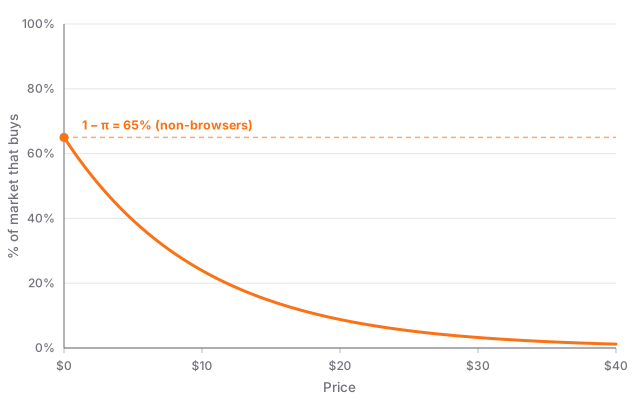
Let’s start by assuming the survival curve of a hypothetical market. Our market will be the market of … I’m going with meteorites because they are awesome. Forged in the heart of a dead planet.
Survival
The meteorite market is not made of a bunch of clones. Different people have different budgets, different affinities for meteorites, different preferences. As a result, people have different willingness to pay, and generally as we increase meteorite prices, the percentage of people who will buy decreases. This is the survival curve.
Competitors
The meteorite market is made of three companies with different strategies. To make the concepts simpler, they all buy meteorites from the same wholesale supplier.
-
Planetary Scrap - The value segment company. Sells lots of meteorites, has less margin per meteorite
-
Orbit Iron - The mid-market company. Decent volume, decent margin
-
Celestial Specimens - The premium company. Lower volume, but best quality and margins
These different strategies provide the backdrop for us to understand smart bidding dynamics.
Valuing A User
In the old days of internet advertising, you would have to set directly what you wanted to pay for a click from a user on a given keyword. This is largely no longer the case, as Google and other advertising services have moved to smarter approaches.
Google collects data on its users and from interactions on advertisers’ sites. When you search for a term that someone is advertising on, Google estimates how much you would be worth to them. For everyone advertising on that keyword, they estimate:
where is the probability that you convert (make a purchase) after clicking the ad, is the value the company assigns to that conversion, and is the resulting expected value of a click from you. In our toy market, that conversion value is profit margin. This is what a click is worth to an advertiser, and it’s the quantity smart bidding is built around.
Now a few people go searching for meteorites online. Google evaluates what each one is worth to each site. The key insight is that these users have different values to different companies.
Say the three companies price and profit like this: Planetary Scrap sells at $12 for a $7 margin, Orbit Iron at $17 for $12, and Celestial Specimens at $24 for $19. They all source the same rough meteorite at the same $5 wholesale cost, so the only thing that differs is how much they mark it up. A shopper only converts at a company whose price their willingness to pay can clear, and when they do, that company pockets its margin. So each company values the same click differently — here’s what a handful of shoppers are worth to each one:
| Shopper | Willingness to pay | Planetary Scrap ($12 / $7) | Orbit Iron ($17 / $12) | Celestial Specimens ($24 / $19) |
|---|---|---|---|---|
| Alice | $14 | $7 | — | — |
| Bob | $30 | $7 | $12 | $19 |
| Carol | $19 | $7 | $12 | — |
| Dave | $0 (browser) | — | — | — |
A dash means the shopper won’t pay that company’s price, so the click is worth nothing to them.
Alice, with only $14 to spend, is practically valueless to Celestial Specimens — she’ll never clear their $24 price. Bob, on the other hand, has a $30 budget: he’d happily buy from Planetary Scrap, but he’s worth far more to Celestial, since they pocket a $19 margin on him instead of $7. So the premium seller covets the Bobs of the world.
But here’s the catch that drives everything later: in this market, Bobs are rare. Willingness to pay falls off quickly, so the shoppers with budgets deep enough to clear a premium price are a thin sliver of the whole. A big-margin sale is only valuable if you can find someone to make it to — and Celestial mostly can’t. That tension between margin and reach is what the auction is about to resolve.
Google doesn’t have perfect knowledge of their willingness to pay, but they have an estimate. If you remember the survival curve from the beginning, that is the aggregate behavior of everyone in the meteorite market. We will model a single person by sampling a specific conversion rate over price such that over time this averages out to our survival curve.
If you look at a few samples of this simulation, you will notice a few things, but primarily that Google’s valuation varies per customer. Notice also that over time the solid orange line, representing the observed market, converges to the overall market survival curve from earlier.
Making Bids
Now that we understand that Google is valuing each user, and that the value of a user differs between companies, we can start to understand how smart bidding works. Google, using the values that it has calculated, places a bid on your behalf. There are several strategies for controlling how they bid, but we will focus on target ROAS bidding since it is the easiest to understand conceptually.
We are working with the idea that Google is roughly a second-price truthful auction. This means that you bid your true value, since there’s no structural benefit to trying to undercut someone else. You also pay what the second-place bid was. Additionally, we are going to ignore quality scores for now to simplify the basic intuition.
In our simplified model, the bid is:
The intuition is clean. Your target ROAS is the value you want back for every dollar of ad spend, and is the value you expect from the click. Dividing one by the other gives the largest amount you can pay and still hit your target — bid any higher and your return per dollar slips below tROAS. So a higher target makes you pickier (lower bids), and a lower target makes you aggressive (higher bids).
Real target ROAS bidding has budget constraints and other adjustments, but on average this is how it tries to bid.
Running the Auction
Now that we have an idea of how valuation and bidding work, let’s run 10,000 auctions and see what happens. Play with the tROAS levers to see what happens.
| Company | Click share | Avg CPC | Conv. rate | Profit |
|---|
(To keep the intuition clean, an ad only shows when the winning bid clears a small reserve, and we’re still ignoring quality scores.)
Some interesting patterns are starting to emerge:
-
As tROAS decreases, volume increases. Bidding more aggressively gets more visitors to the site.
-
As tROAS decreases, so does conversion rate. As we bid more aggressively we get more traffic, but it’s lower quality on average.
-
The market is complex and interwoven. Each company’s choices affect the others significantly.
The Second Lever
There is another important bidding lever though, and that is pricing. Pricing shapes who a company is capable of monetizing, and since Google learns how visitors interact with a site, it also affects how Google bids. Here’s another simulation, but now pricing is an additional lever. Notice how it affects overall profitability and average CPC.
It’s a very important lever because it directly shapes the bidding system.
| Company | Click share | Avg CPC | Conv. rate | Profit |
|---|
This heatmap shows the selected company’s profit at a combination of markup and tROAS.
Caveats
This is a very simplified model, and lots of assumptions were made. Real advertising systems include budgets, pacing, and attribution. Different companies sell different inventory and have different acquisition costs. Also, quality scoring is very important and has been removed here to simplify.
Additionally, this simple model is quite prone to weird artifacts caused by second-price bidding. Some noise is introduced (outcomes are strategically randomized) to help smooth the behavior of the auction. This is probably somewhat realistic, since Google certainly doesn’t have perfect estimates of how someone is going to behave.
Real systems also likely have some source of exploration or counterfactual data. If you only ever send traffic where your current model thinks it should go, it becomes difficult to learn whether the alternatives were actually better.
All that said, it is probably possible to build a more robust simulation, but the goal of this was to examine some of the basic core structure of how smart bidding might work.
Interesting Observations
One of my all-time favorite things to do since I learned to code in high school is to create a simulation and observe results. This simple simulation still shows a bunch of structural artifacts that I think are probably realistic, and certainly interesting.
First, CPC and revenue are economically and intrinsically linked. Revenue affects who you are willing to bid for, and if you are making more money on a conversion, you are willing to pay a lot more. This doesn’t mean a rational player should cut or raise prices; it’s very contextual.
Second, tROAS is a strong selection lever. Since tROAS is essentially an aggressiveness lever, as you are willing to be more aggressive, you acquire lower-quality traffic. You make more revenue, but also incur more cost as click volume increases.
Third, ideal profit settings are usually flat near their optimum. Profit peaks where the gains from additional volume are balanced by worse traffic and higher CPC. Since the slope is zero at the optimum, small changes around it often have surprisingly little effect on profit. There are only minor gains to be had by being perfect at optimizing.
Overall, optimizing bidding would require careful consideration of each variable at play.
Nash Equilibrium
Now this is my favorite observation, and it deserves its own section. A Nash equilibrium is a concept from game theory: a state where no player can improve their outcome by unilaterally changing their strategy while everyone else stays put. In our case, it’s where no company can increase its profits by moving. Each company is operating at its maximum attainable profit given the settings of the other companies.
Let’s start by looking at the singular lever case (tROAS). Imagine that the companies all start off by setting tROAS to its maximum (3). The companies rake in profits.
| Company | Profit |
|---|---|
| Planetary Scrap | $53,400 |
| Orbit Iron | $32,200 |
| Celestial Specimens | $41,800 |
| Total | $127,500 |
However, any one of these companies can make a lot more money by setting its tROAS to its optimal value, which gives us its “ideal profit.”
| Company | Ideal tROAS | Old profit | Ideal Profit |
|---|---|---|---|
| Planetary Scrap | 1.65 | $53,400 | $60,800 |
| Orbit Iron | 1.20 | $32,200 | $57,300 |
| Celestial Specimens | 1.15 | $41,800 | $61,300 |
As you can see, they have an incentive to do so. Now, what happens if we start having each company optimize its profit? We set a company to its ideal tROAS, run the simulation, and do this for the next company. I expected that if we did this and repeated it again and again we would eventually get more and more aggressive, bids would get pricier and pricier, and the companies would eventually make little money.
It turns out that this is not the case. We actually reach a Nash equilibrium rather quickly. Companies are still making decent money, but far less than before:
| Company | Nash tROAS | Profit | Change from start |
|---|---|---|---|
| Planetary Scrap | 1.90 | $34,600 | −$18,800 |
| Orbit Iron | 1.65 | $10,300 | −$21,900 |
| Celestial Specimens | 1.10 | $31,300 | −$10,500 |
| Total | $76,200 | −$51,300 |
This is a classic problem that shows up everywhere. If the companies had just kept the status quo at the start, they would have all made more money, but competition drove margins down. Each company’s move is individually rational, yet after everyone responds, all three are worse off.
Now this case we looked at is just about adapting tROAS, but we had a price lever as well. Given that there is a distribution of users with different price points, it sort of makes sense that eventually everyone serves their own segment and we get an equilibrium because of fixed prices.
Interestingly though, even if we run the same process and allow price as an optimization lever, we still get an equilibrium. We even get convergence when everyone starts at the same settings and optimizes at the same time, so this equilibrium doesn’t appear to depend on a first-mover advantage. There is a small amount of noise that allows this to happen, but the point is, the equilibrium is intrinsic to this simulation.
Super interesting, but the question is, how realistic is a profitable equilibrium? That’s hard to speculate on. I’m basically certain that competition compressing margins in an ad auction is a real effect, given how interconnected bidders are.
I also suspect an auction operator has incentives to avoid dynamics where one advertiser’s small structural advantage lets them permanently dominate the market. If competitors disappear, so does bidding pressure. That part is speculative, but it seems directionally reasonable.